QAQC
BikePed Portal employs QAQC flags to all permanent count locations. The QAQC flags include:
- zero-run length (e.g. the number of consecutive zeros)
- non-zero run length (e.g. the number of consecutive non-zero volumes)
- rolling median (daily volume compared to median volume from past 27 days)
For more details on how the calculations were determined please refer to McNeil and Tufte (2018).
How to use the QAQC tool
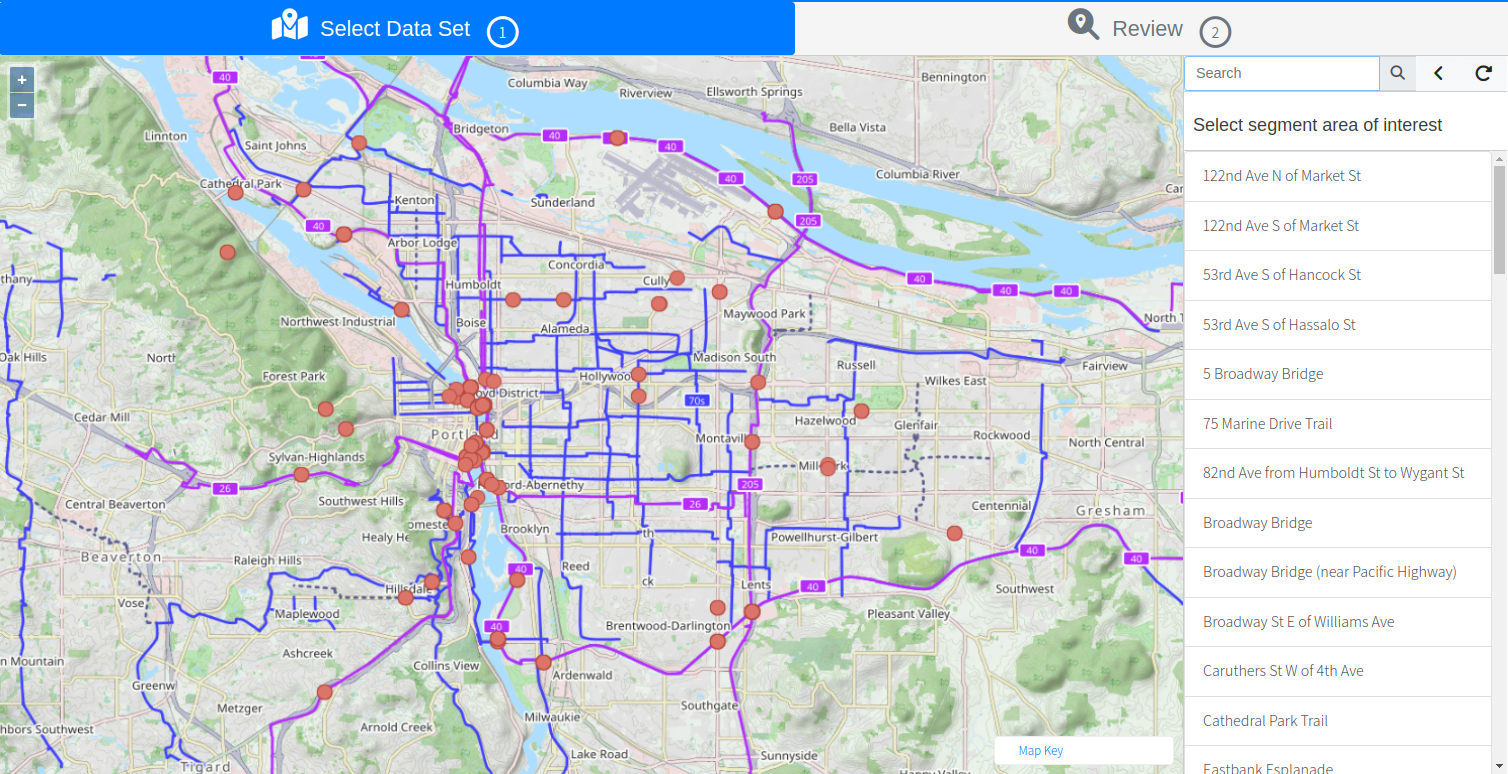
Step 1: Select a flow detector
After selecting the QA/QC tab on the left sidebar, you will automatically be shown the organizations you have permission to view or edit. If your organization membership has detectors located in multiple states, you will then be directed to pick a state before being given the option to select a segment area of interest.

Once the segment area of interest has been selected, a list of flow detectors will be displayed providing the flow detector ID, flow type (e.g. bike, pedestrian, other), and direction (e.g. E, W, undefined). Once the flow detector of interest has been selected, the interface will switch to the “Review” tab.
Step 2: Select the data period
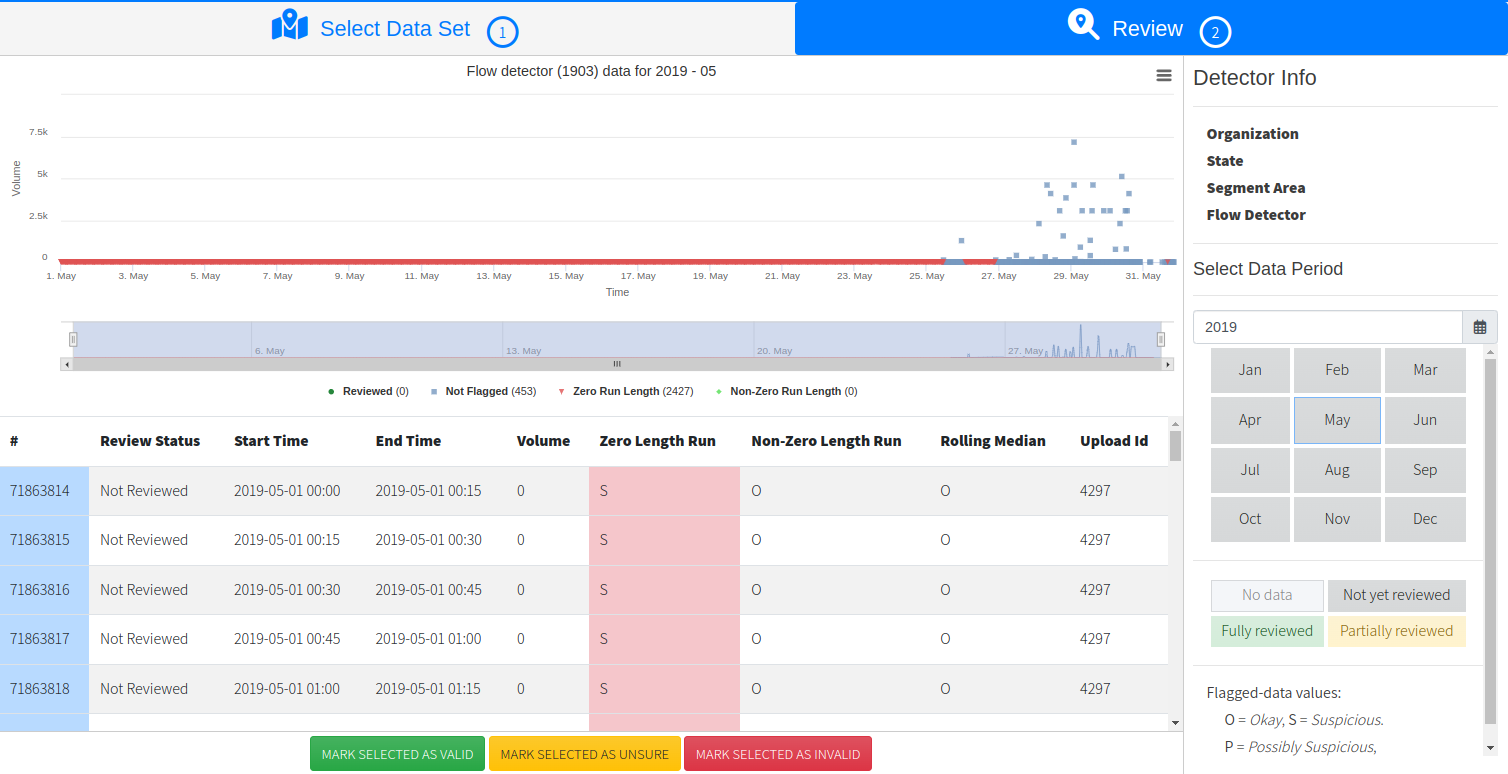
A display of the most recent month of data is the default display. Use the sidebar on the right to select the data period (e.g. year, month) and see which months have “no data”, “not yet reviewed”, “fully reviewed”, and “partially reviewed”.
Once a data period has been selected, the chart will update with the raw data and any visual flags for that month.

Users can either use the range selector at the bottom of the figure, or highlight the figure, to select the range of data of interest. The table will update to show which rows of data have been selected. Once the data are selected, choose one of three reviewer options “mark selected as valid”, “mark selected as unsure”, or “mark selected as invalid”. Changes made will be updated immediately.
Step 3: Download data
When users download data from the “Download Data” page, data flags and review status are also included.