Explore
The following tutorial will describe how to navigate and use the tools available on the Explore page.
Select by “States” or “Region”
Start by selecting the “States” or “Region” option for selecting a data set of interest. The “Region” selection is a predefined geographical boundary determined by multi-agency partnerships that can include multi-state boundaries. At any point during the selection process, to go back one level click on the “<” button located next to the search bar in the right sidebar menu. To start the selection process from the beginning, click on the refresh button next to the “<” button.
“States”
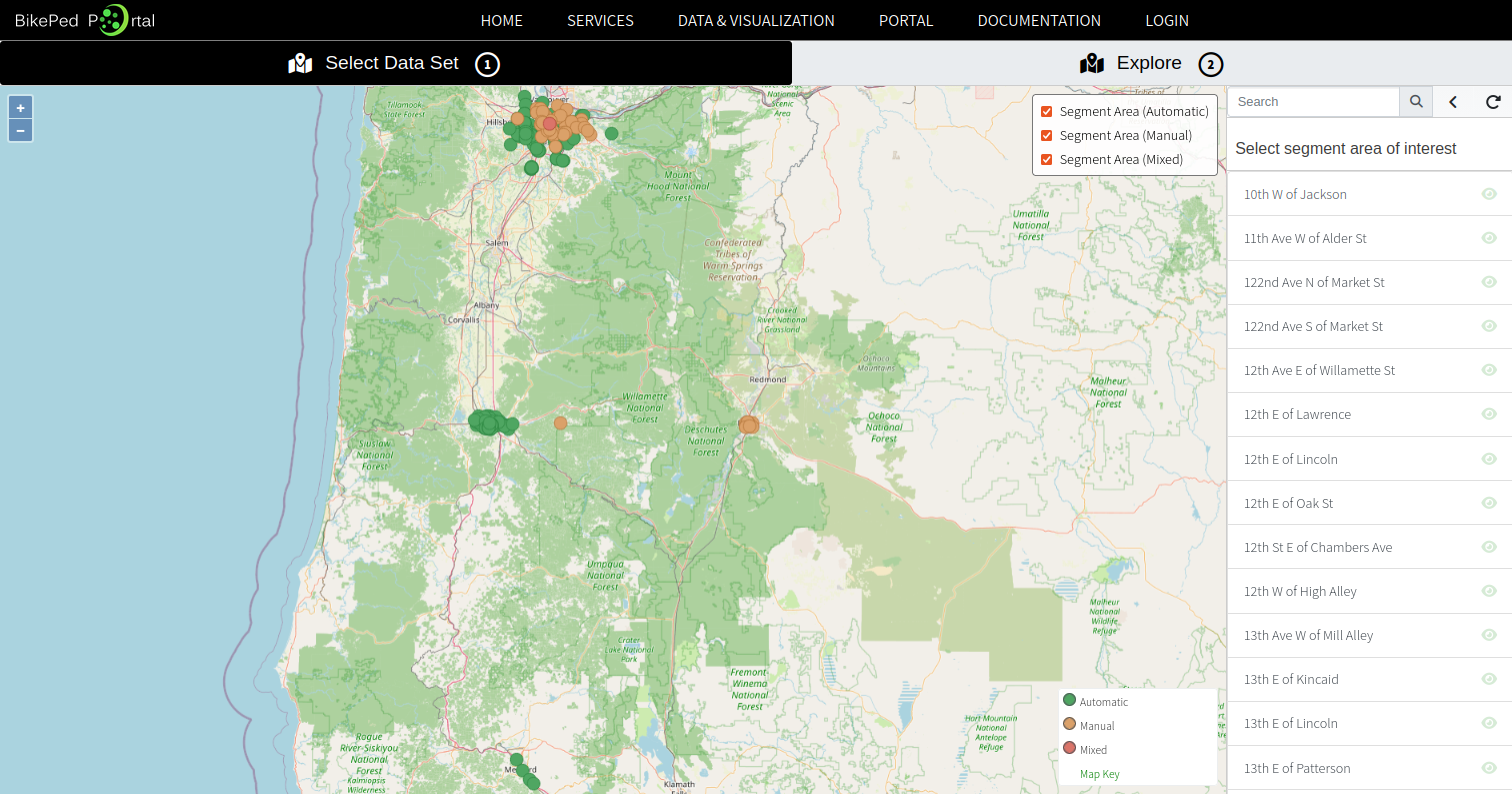
When selecting “States” a list of available states with data are provided. Continue by selecting a state of interest and a list of available locations will appear in the right sidebar menu and the map will zoom into the state showing all the available locations (Fig. 1).
“Region”
A list of predetermine regions are provided after selecting the “Region” option. Once a region is selected, a list of segment areas are provided. A state agency may have segment areas located within a region and also within the state, but selecting a region will only show those segment areas within the geographical boundaries of a region.
Select segment area of interest data set
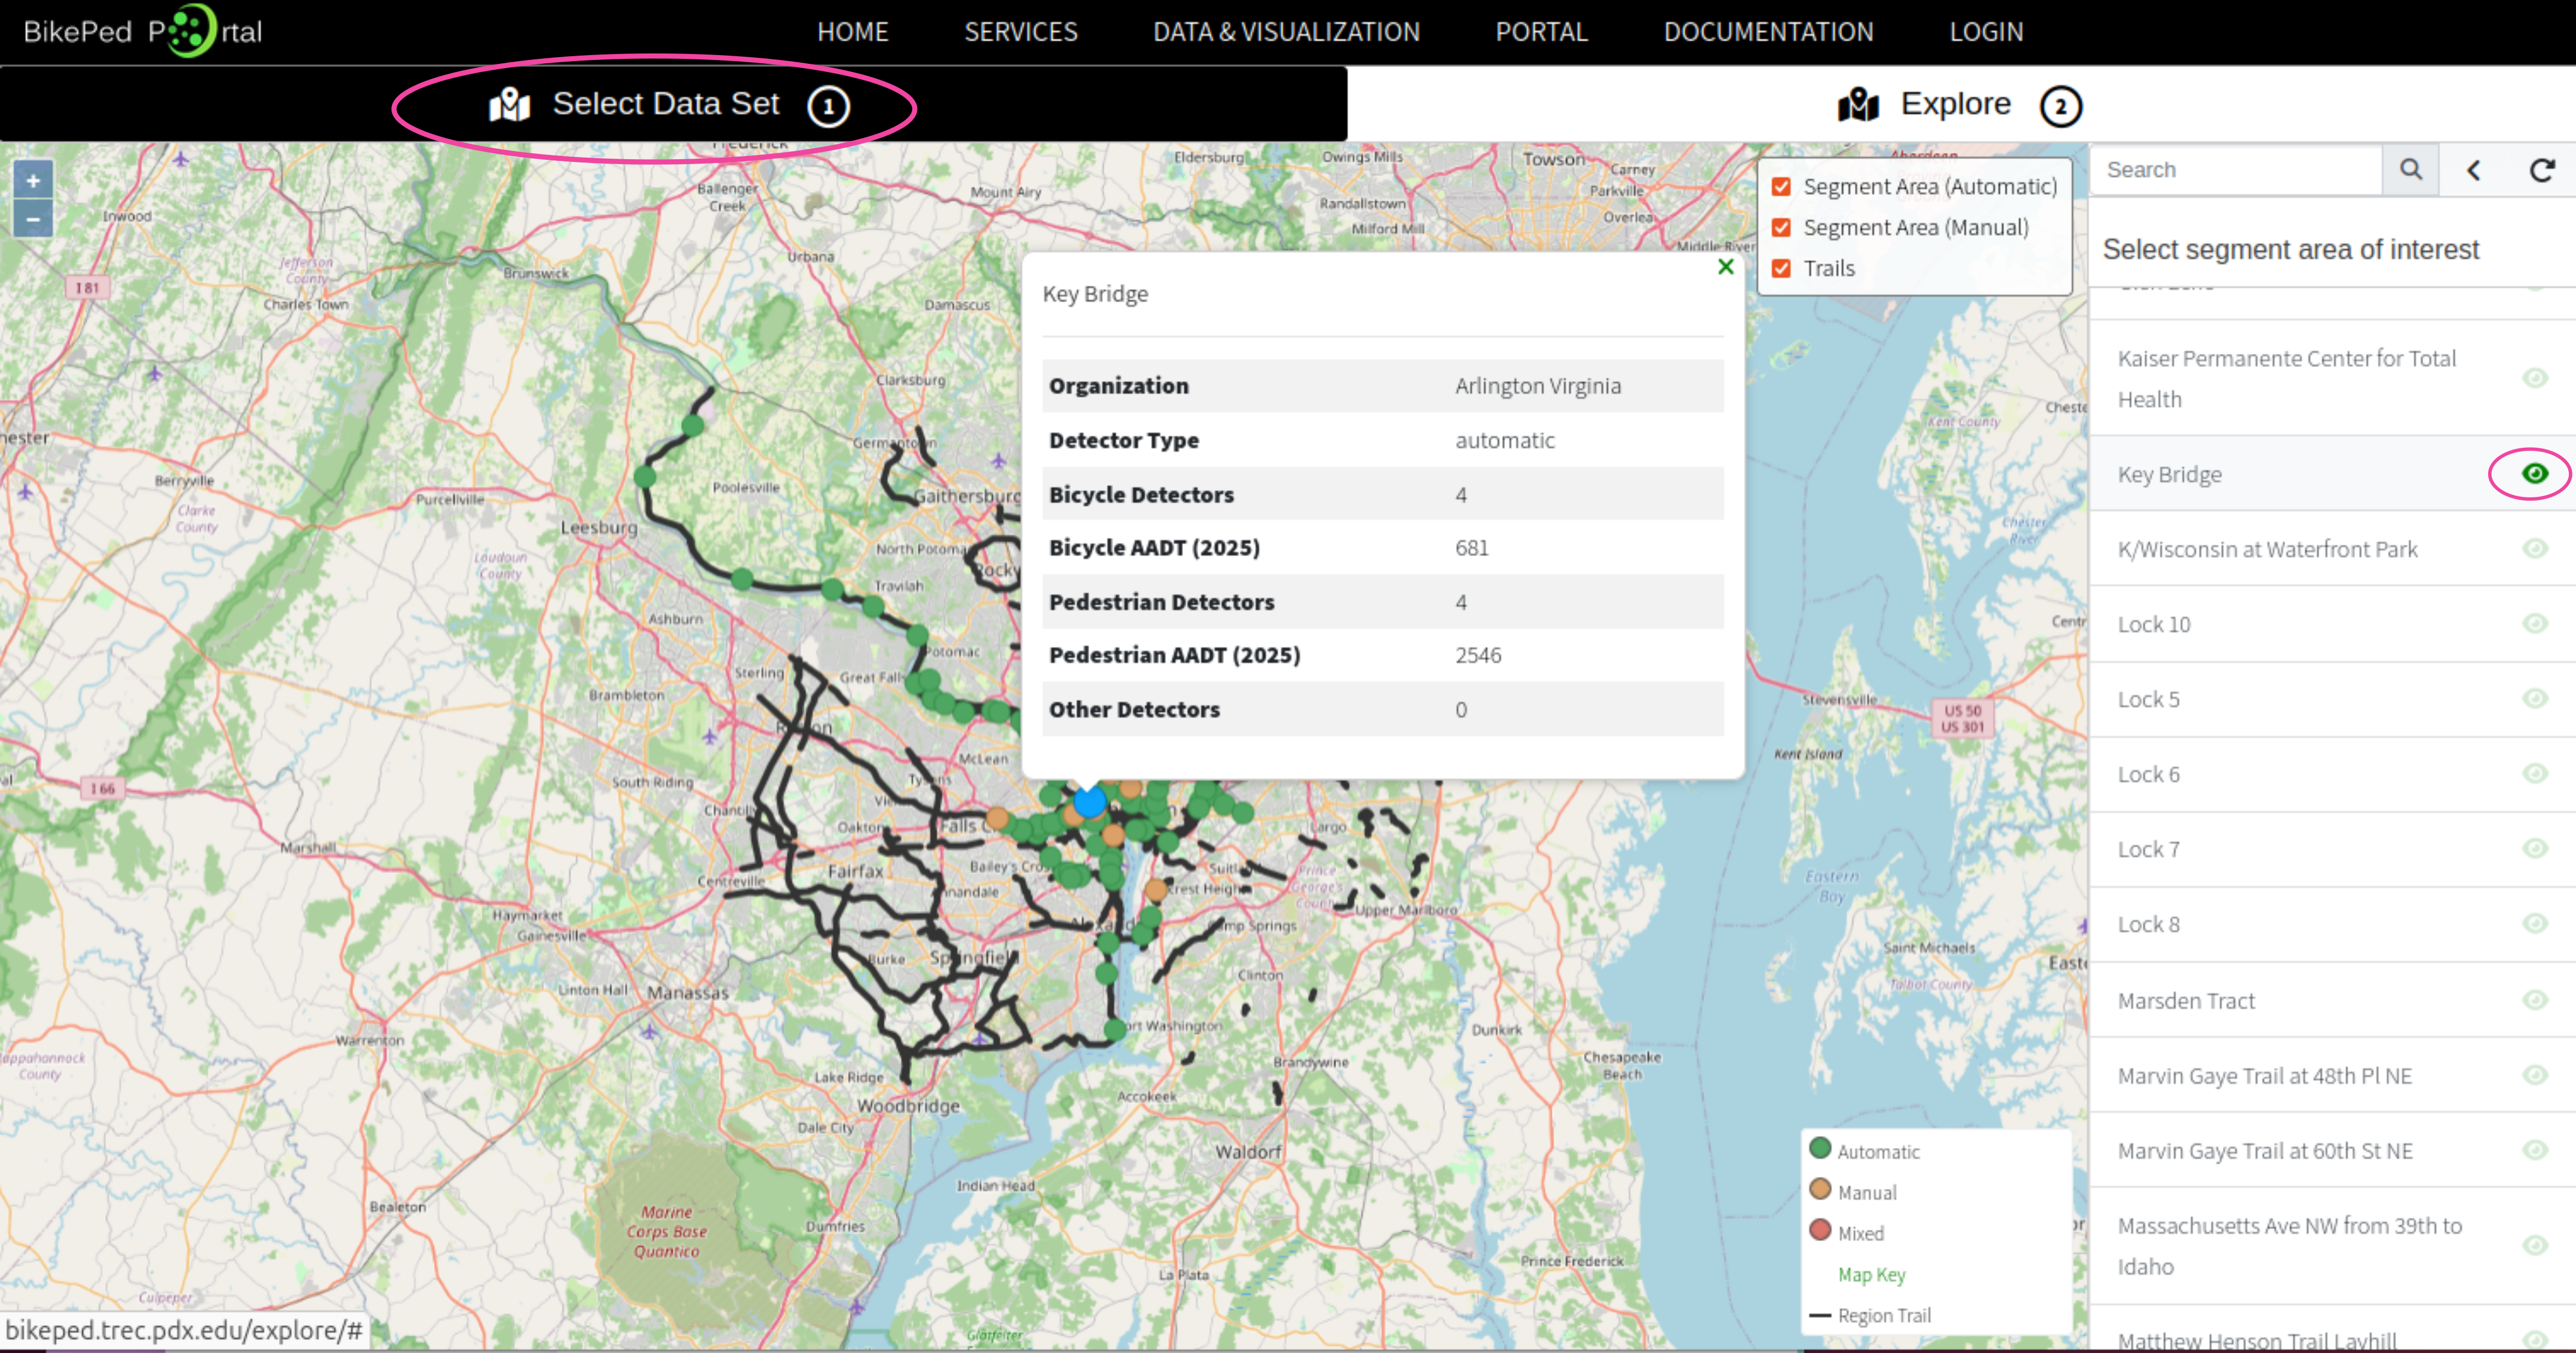
Please note that at the top of the page, the selected tab is “Select Data Set (1)”. You can select a segment area by searching for the name of the segment areain the right sidebar menu, “Select segment area of interest”, or by clicking on a circle icon on the map. If you know the name of the segment area, use the search bar a the top of the right sidebar menu. Clicking the “eye” icon next to the name of the segment area will show the location on the map and some metadata (Fig. 2).
Explore
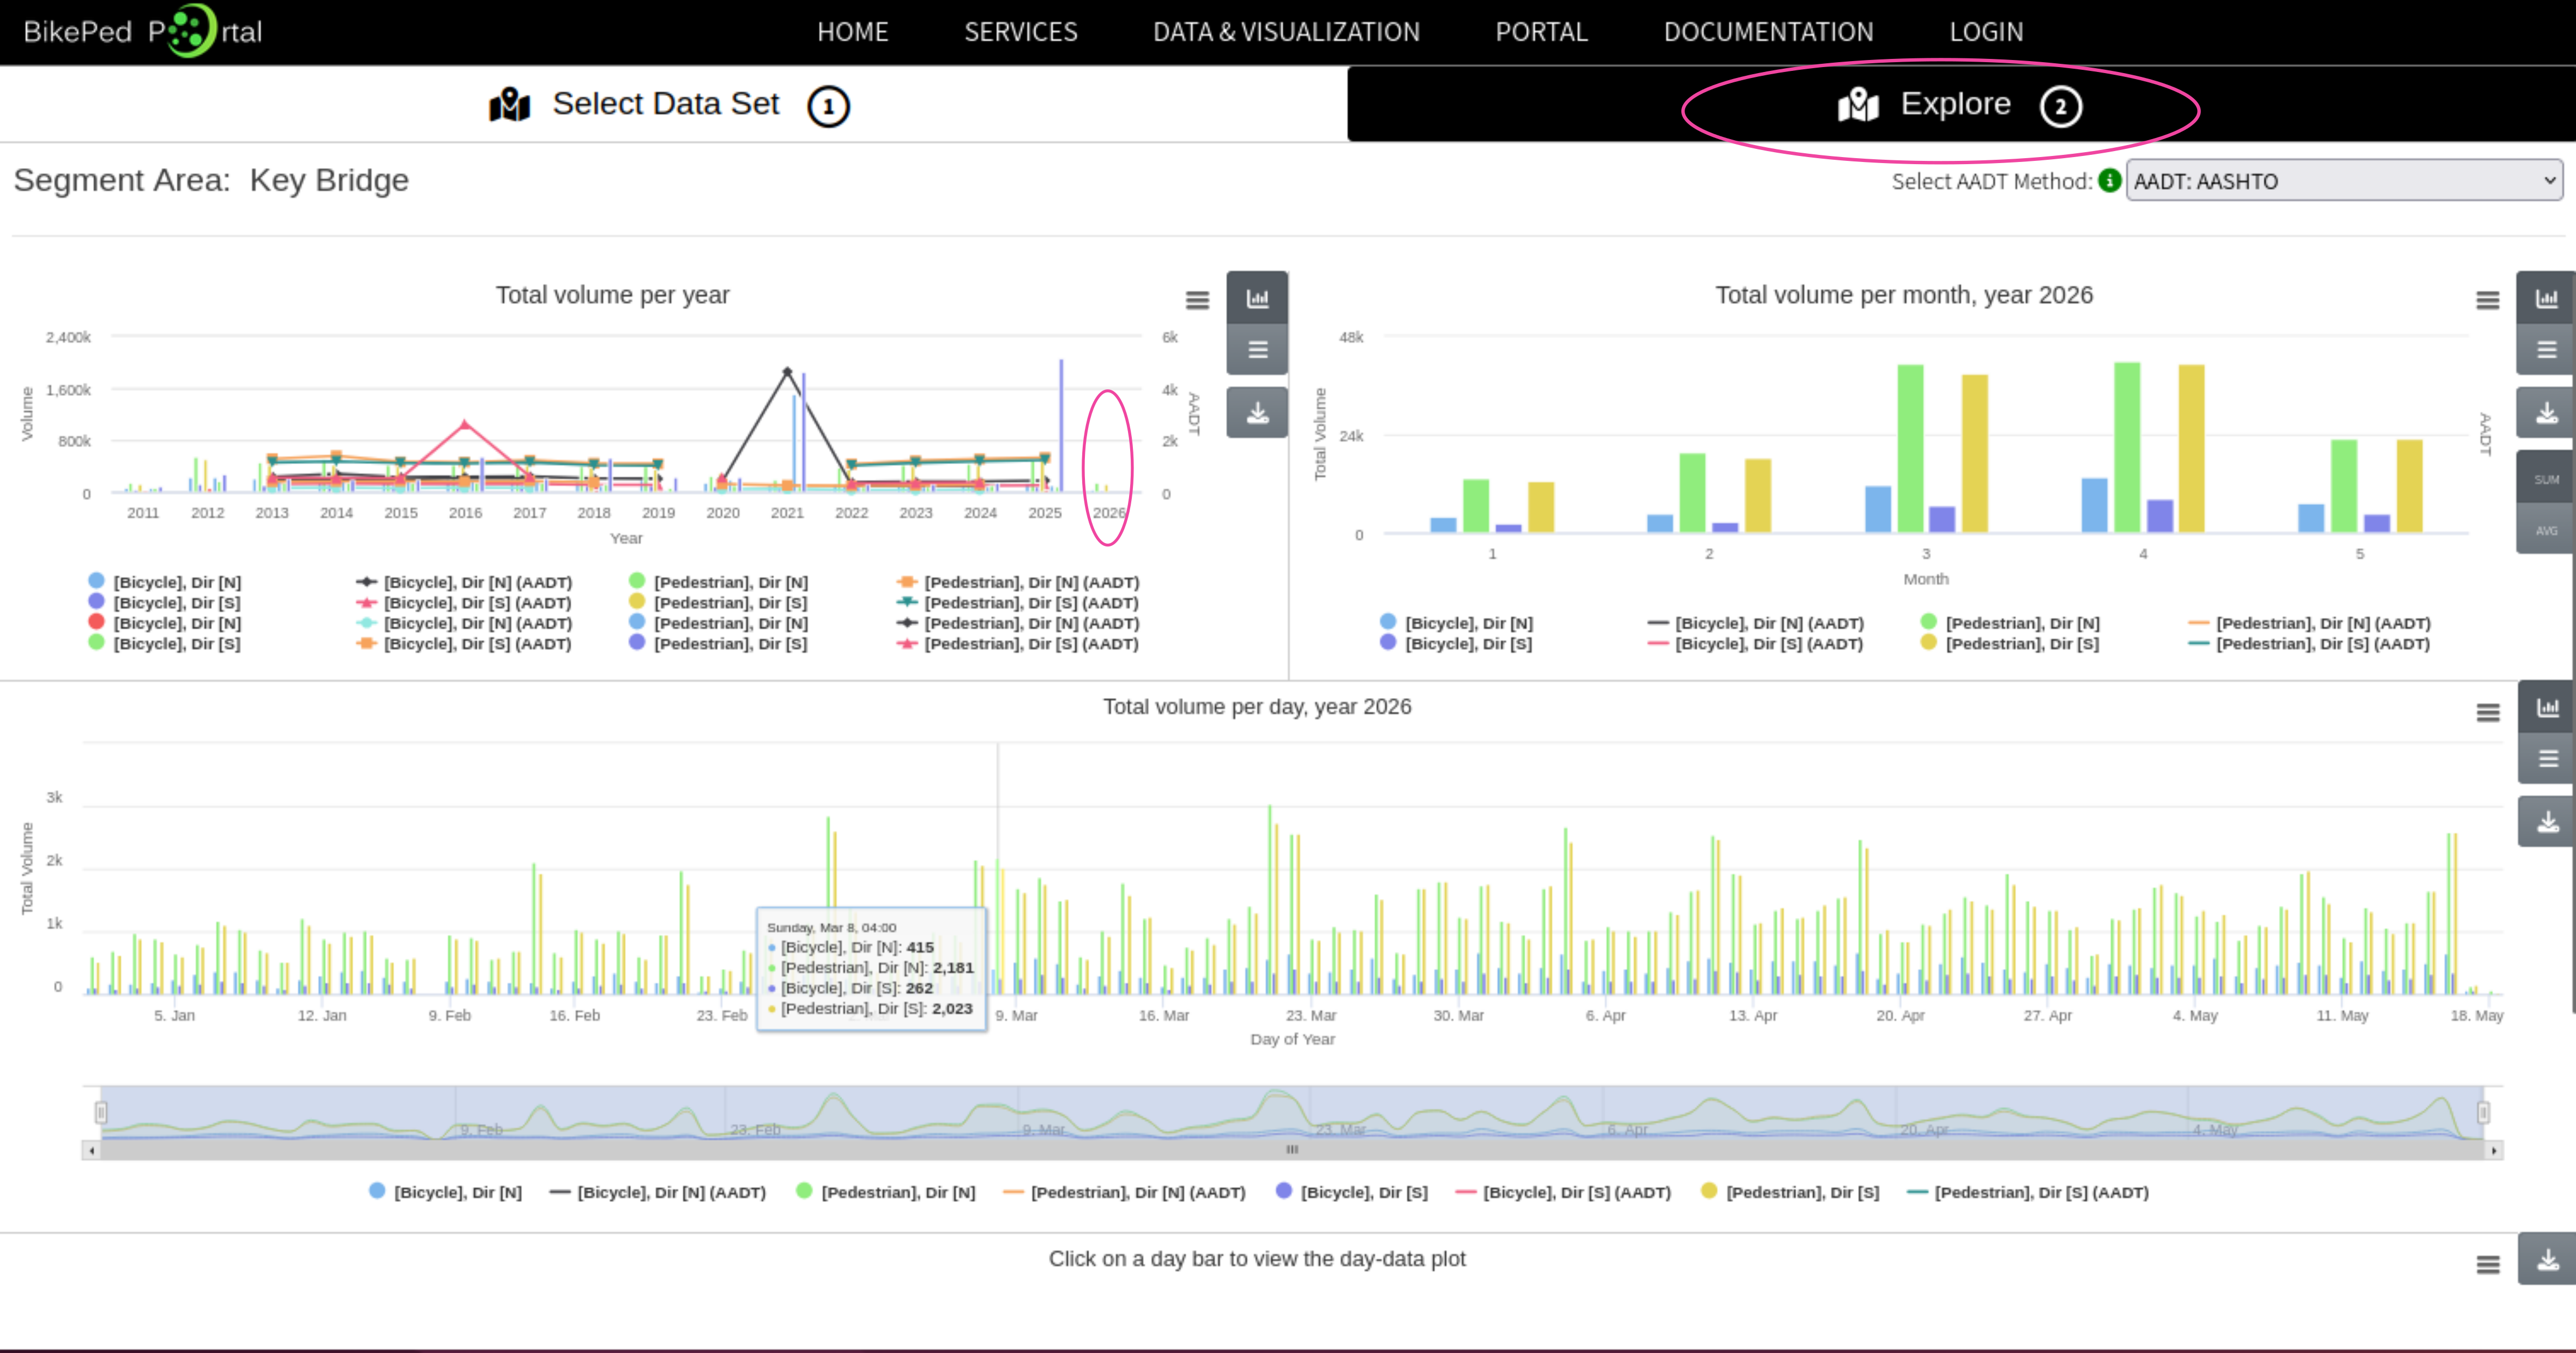
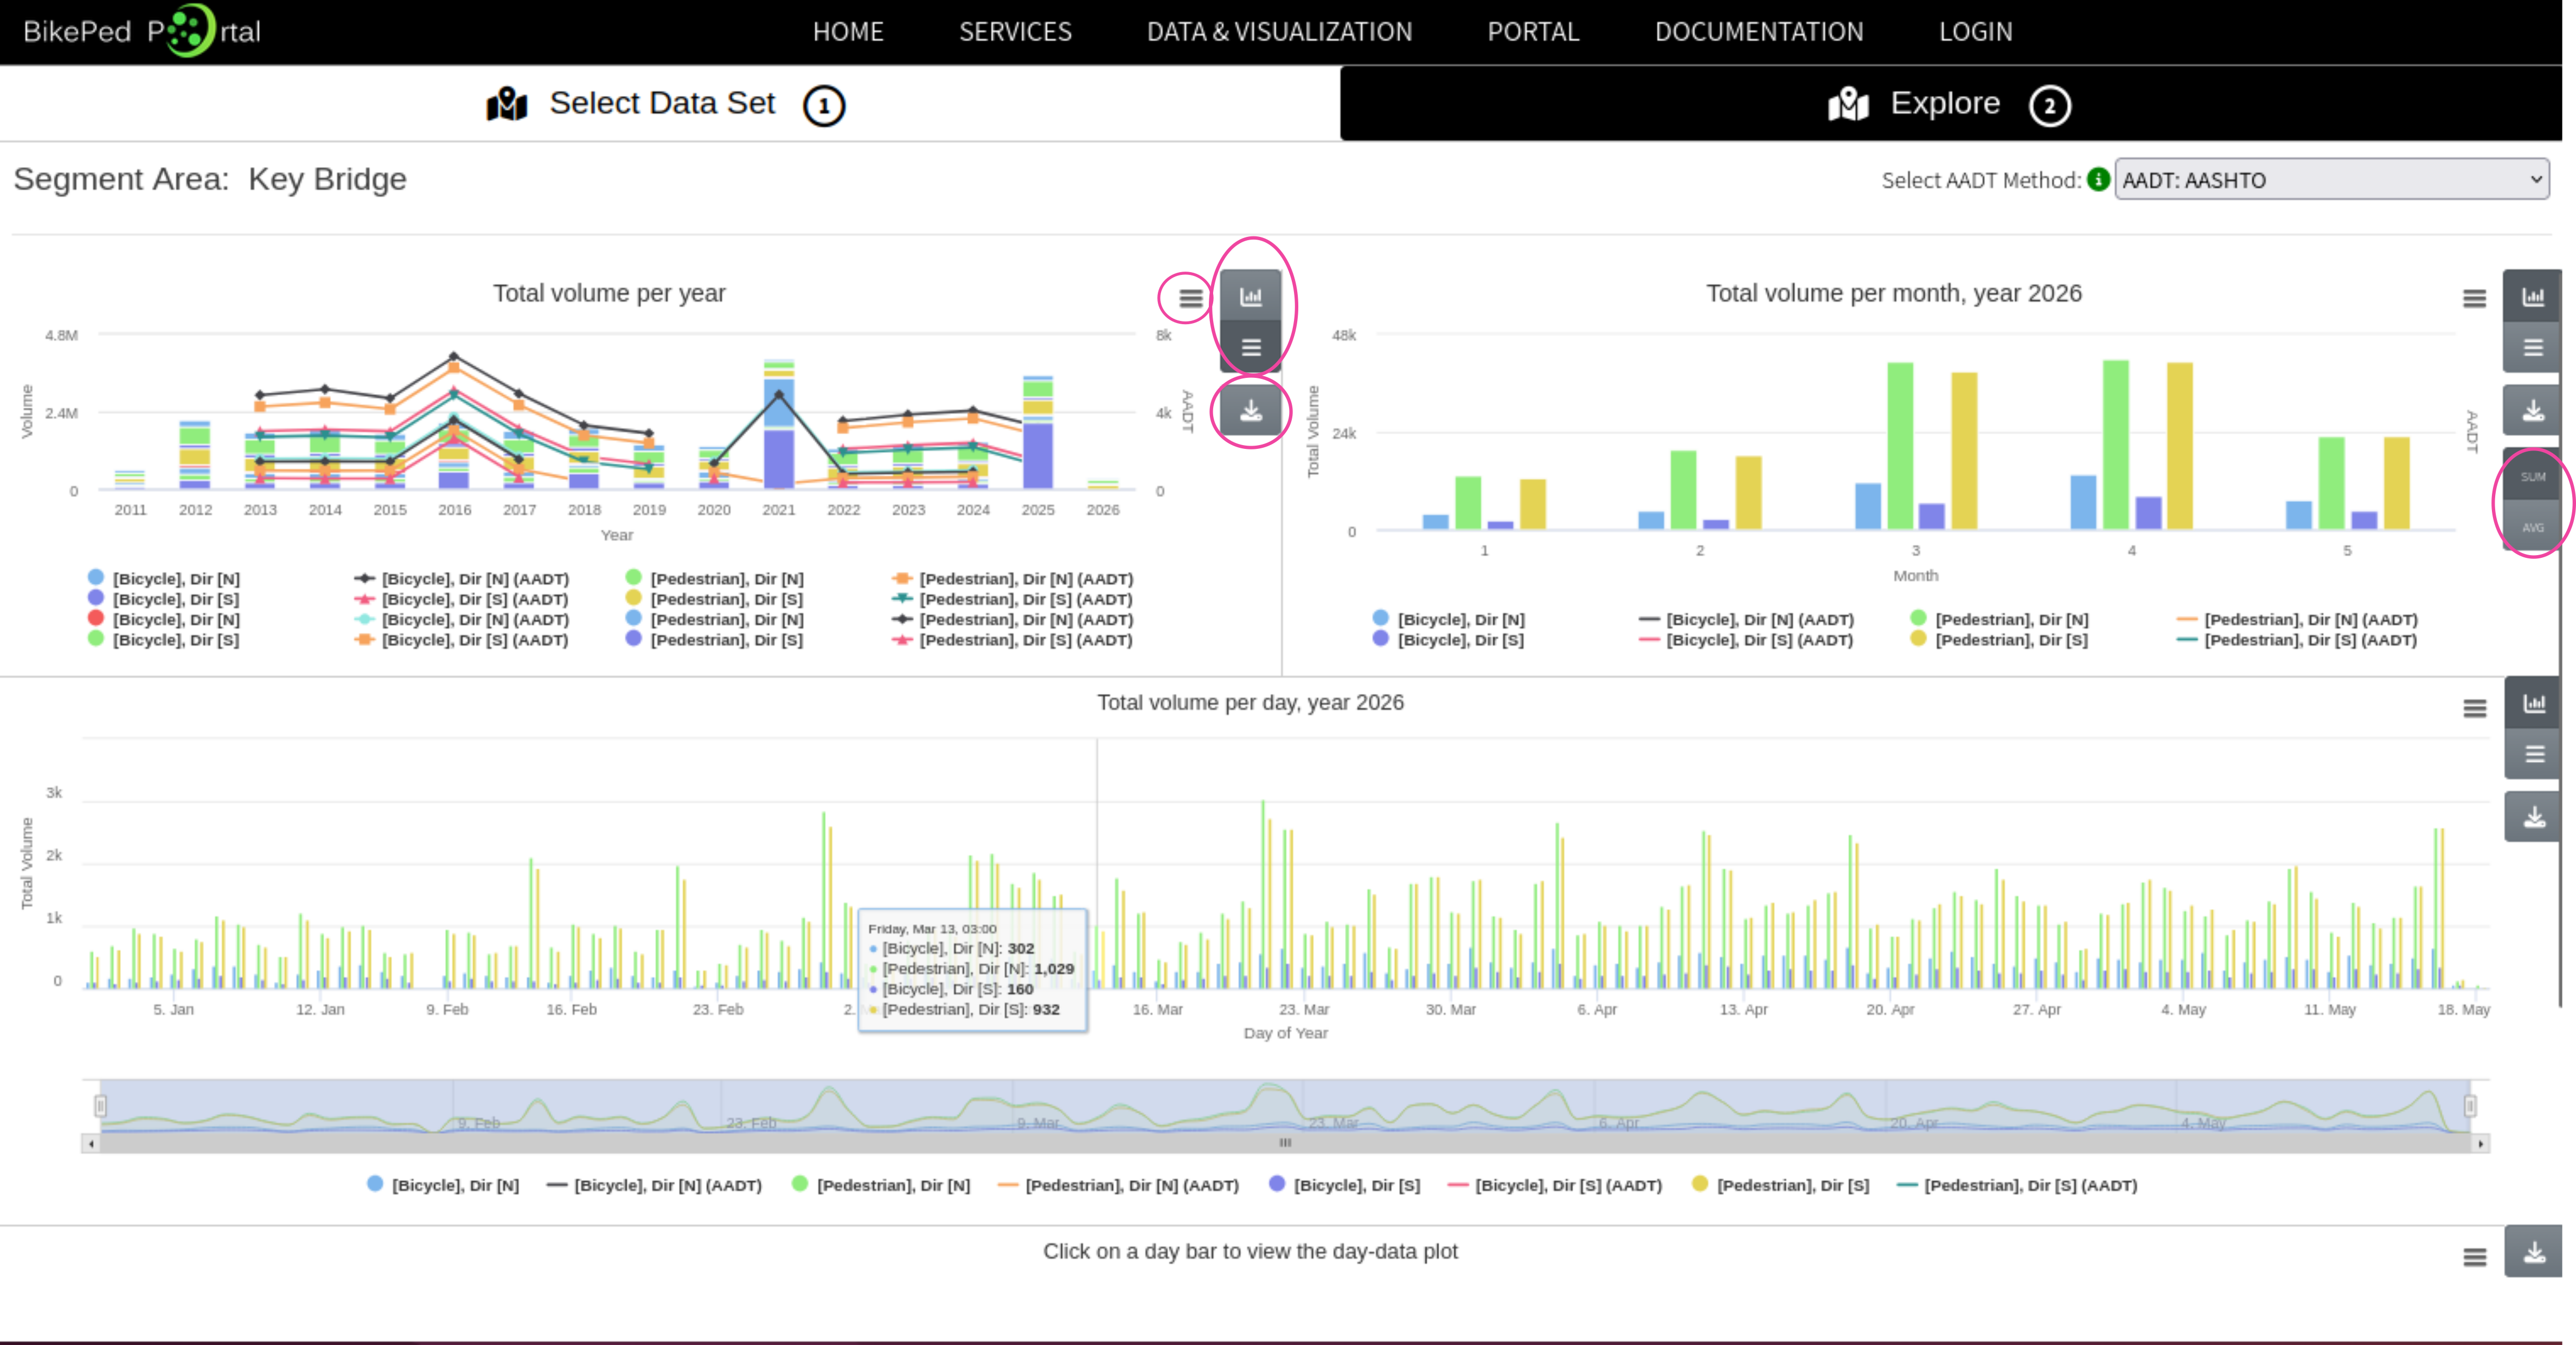
After selecting a segment area a new tab will open, “Explore (2)”, showing yearly data of the selected segment area. If at any point you want to select a different segment area click on the “Select Data Set” tab and then either click on the “<” to go back a level, or refresh button to start the selection process from the beginning. To get monthly aggregated data, click on the year of interest from the yearly figure and data available for that year will populate the monthly and daily volumes (Fig. 3).
Downloading figures and data
Figure 4 highlights the different icons that are available for each figure to change the chart type, download the figure, and download data. To alter the bar chart to a stacked bar chart, click on the stacked hamburger icon below the bar chart icon. For monthly volumes, there is an option to display the total monthly volume and the average monthly volume. To download data, click on the “download” icon located below figure graphing options. The data that is downloaded for each figure is the data behind the figure, this means that if you click the “download” button on the “Total volume per year” figure, only the yearly data will be provided. If you want to download the figure, click on the other hamburger icon next to the graphing options.
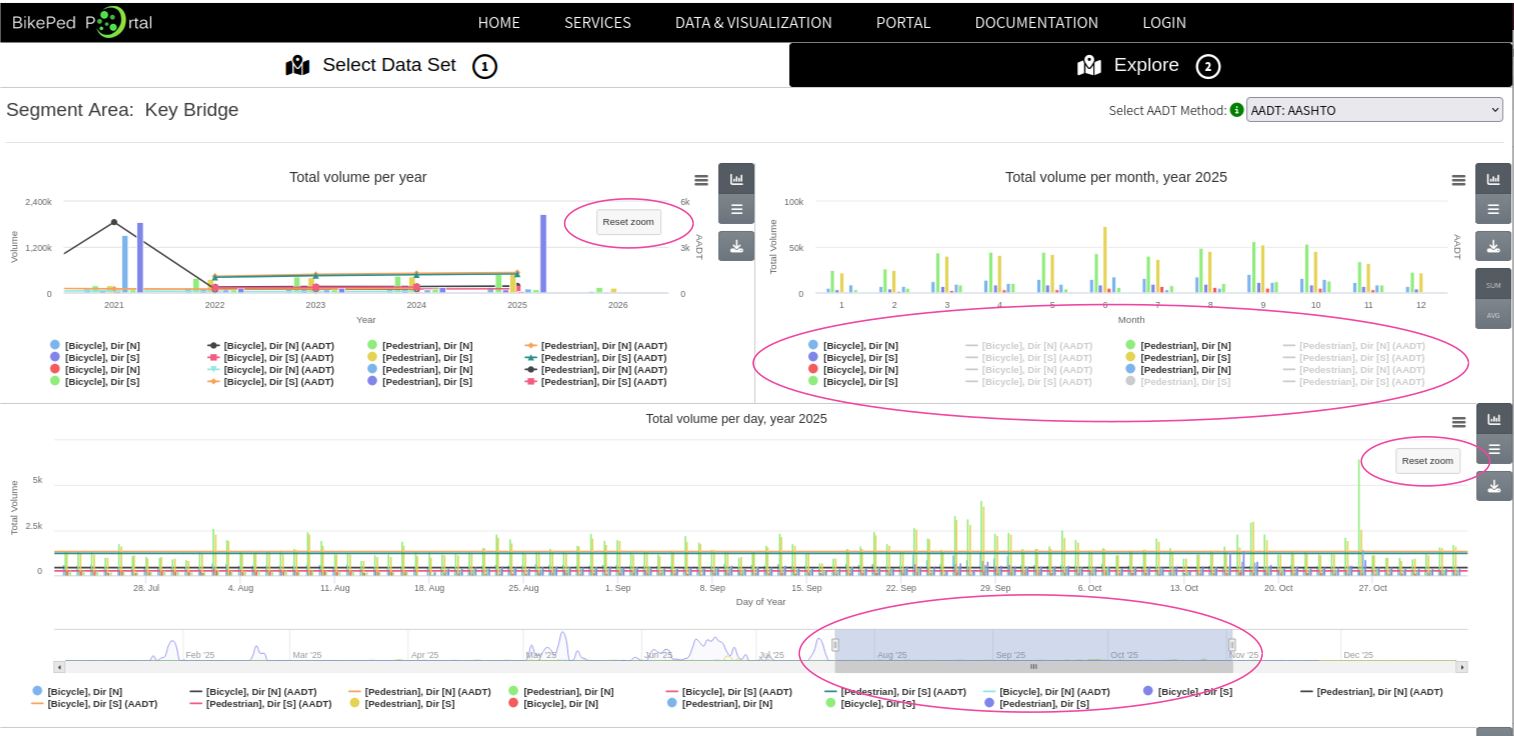
Zoom into and select date range for display and showing different data types
There are additional options to be able to zoom into or turn off/on different data types to display within each figure panel (Fig. 5). To zoom into a specific date range, you can click and drag on the figure to highlight the date range of interest. For daily volume, there is an additional slider below the figure create a window of time. To turn off/on different data types that are being displayed, click on data type within the legend of each figure.